Category: Photos

Maps, Mergers, Detours and the Other Direction
Maps, Mergers, Detours and the Other Direction

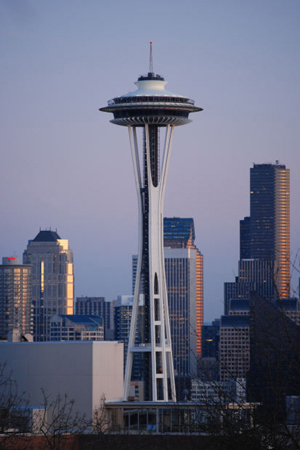
I just got back from Seattle (my OTHER favorite city), from a whirlwind trip to a Clarion party to see my old writing instructor Connie Willis (she teaches a mean reversal and wonderful lessons on plot). I travelled with another of my Clarion classmates (Class of 2001) and we were struck by a few things that got me thinking about maps and directions and foreign countries.

You see, there we were following the directions provided by Google maps (I prefer maps over GPS any day)and we were trying to get from I5 to the Queen Anne area when we discovered that there apparently is different English used for American directions than for Canadian. The American directions told us to merge when to Canadians it was clearly a left hand turn. ( A merge being something you do from an onramp onto a freeway.) In other spots we were told to turn left or right, when clearly to our Canadian eyes it was a merge. Needless to say, while we didn’t get lost, there were times I was seriously glad I wasn’t a driver behind us. I mean what were these crazy foreigners doing?
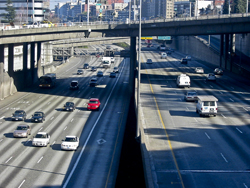
Of course our trip home wasn’t any easier. Not only did we have to navigate the many one way streets, that area of Seattle seems perennially under construction so we had to deal with detours. The main Lake Washington Bridge was closed which meant we couldn’t easily take a side visit to Redmond, and the downtown was also chewed up by construction so that we had to follow detour signs to get to I5 again. The interesting thing was, if we hadn’t been going to visit friends in Redmond we would have been seriously in trouble, because the detour signs just got us to the highway – headed south instead of back to Vancouver. Later, as we attempted to find our turn off, we had to deal with signs that said X Exit merge left and then, a quarter mile later, X Exit merge right.  Again I was glad of my foreigner license plates that at least gives me some license to be a little confused as I madly slalomed across the highway.
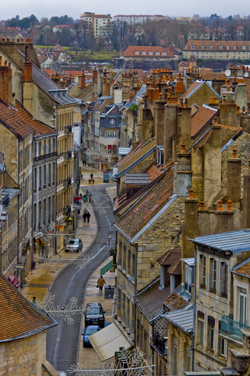
Christmas Street, Besconson, France (2005) Photo (c) Karen Abrahamson

All of this put me in mind of my travels in other countries where charming street signs have tickled my fancy. My favorite continues to be crossroad signs in France:  Paris with an arrow pointing in a certain direction, to Pontarlier, with an arrow pointing in a second direction, and a third sign with an arrow saying Les Autre Direction (the other directions). Maybe it’s just that North Americans have more need for specificity, but these signs always made me snort with laughter. I mean, of course the sign pointed in another direction, the question (for me) was what direction was it? Although I drove many places with my friends I don’t recall ever driving in that direction. So today as I wended my way home through the deceiving streets of greater Seattle I think I may have found myself unknowingly travelling Les Autre Directions. The surprising thing is I got to where I wanted, whether the signs led me there or not.
 

Mapping the Mind: Birds, the Inuit and Urban Development

Mapping the Mind: Birds, the Inuit and Urban Development

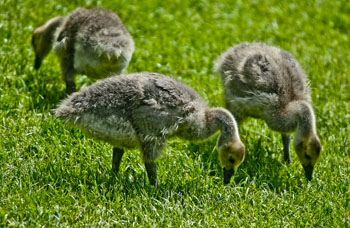
Canada geese goslings. (2012) Photo (c) Karen Abrahamson

Last week I wrote about some of the maps that helped create a country. This week I want to write about maps and development here in my little bit of Canada. You see, recently I attended a City planning meeting about the planned development of said city over the next thirty years. The city planner was there to gain input to the plan, so like I am wont to do, I opened my mouth. I asked whether there were plans included for city parks that were more than playing fields. In particular I asked about retention of trees.

You see the city plan targeted three areas of the city for development. This meant that the areas that currently hold some of the last large acreages with the last stands of mature trees would be logged off and cut up into micro-lots of high-density houses and townhouses. If the development practices I see in other areas of this city are any indication, the landscape will be reduced to a wasteland of ticky-tacky houses and spindly trees planted so they don’t block resident’s views. The aim is to build the highest number of houses on the smallest lot, which doesn’t leave a lot of room for trees. Land costs too much.

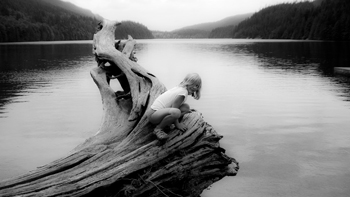
Jo at Buntzen. Children need the opportunity to be close to nature. (2011) Photo (c) Karen Abrahamson

I know, I know. People have to live somewhere, but the prospect of this loss left me so angry I felt poisoned inside. I’ve been trying to figure out how my perspectives have wandered so far into ‘radical’ territory from what now seems to be mainstream. You see, I worry about the other creatures we share this earth with. I worry about the air-cleaning capacity of the trees we’re cutting down. I worry about the birds and the squirrels and the other creatures we’ve displaced with our houses.

The worst part of the episode was that few people in the meeting seemed to share my concern.

A recent survey of birds in Canada, showed a decline of 40% plus across most species. Here in B.C. the decline is 35%, but with every development permit, you can bet the bird population is a little bit less. Over the last ten years that I’ve lived here, the flocks of swallows have decreased so I see less than ten on a morning walk. In my own townhouse complex, the council is continually cutting down lovely mature trees that provide homes to song birds and safety from predatory crows and starlings, in order to improve the view of some homeowner.

So what does this have to do with maps, you’re wondering. Well I recalled reading about Inuit maps and how they are ephemeral things. Each member of an Inuit tribe builds cognitive maps that remember and recognize different things. Shamans remember where malevolent spirits dwell. Hunters carry knowledge on moving over the landscape and the sea, while the women recognized the safest campsites and the sources of berries and seaweed. When asked to draw maps of particular areas, Inuit elders drew proportions skewed with places of greater importance presented larger, and those of lesser importance, drawn smaller. Place names, unlike our western tendency to name places after historical people, are based on a location’s physical, biological or ecological significance. Their names evoke images like ‘the place where the rocks are warm from the bodies of walrus’, or convey not only that a place is flat, but also that in winter the land and sea look continuous. For the Inuit, a map is not just a representation of the world. It becomes a lens that layers meaning on a place and that meaning is carried in place names.

Right now, with the inroads of western culture on the north, the place names that made up these northern cognitive maps are being lost, and placing at risk the understanding of the relationship of the Inuit to the land they inhabit. This seems to be what has happened in this city. People have forgotten the importance of having nature around them, and thus it is being eroded away. The loss of a word, the felling of a woodlot. It happens so gradually and then the knowledge is lost and the trees and birds are gone.
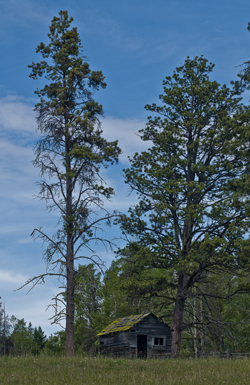
Cabin on the Kane Lake Road, B.C. (2011) Photo (c) Karen Abrahamson

I’ve come to view myself as one of the old ones that carries an old fashioned cognitive map of what my city should look like. Unfortunately no city planner understands what I’m talking about and hat no one but maybe an anthropologist or someone of my generation might understand my anger.

I wonder if the Inuit language contains a name for a silent landscape where no bird sings and all the houses look the same.


Clothing Might Make the Man, but Maps Make the Country

Clothing Might Make the Man, but Maps Make the Country

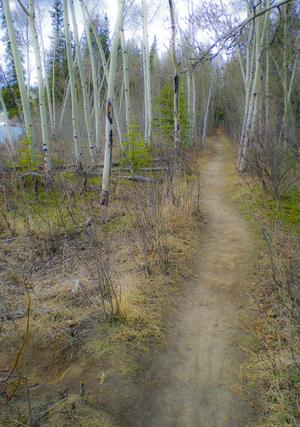
Path along the Yukon River. The quiet places like this are the ones lost in rampant development. (2010) Photo (c) Karen Abrahamson

I thought I’d throw a little light on my home and native land in honor of Canada’s 145th birthday on July 1st.

Maps give shape to countries, both real and imagined. I’ve written previously of the long search for St. Brendan’s Island in the Atlantic and how the need to establish Prestor John’s country influenced the maps of Asia and Africa. But beyond creating imaginary countries and geography, there are three real ways that maps can help build a nation and all of these have been used to build Canada. Maps can:

1. Help the populace visualize the their nation and understand their borders;

2. Take a geographic area and turn it into a political abstraction such as the Canadian state, and

3. Mediate relationships between states and their population and can act as a means of ‘erasing’ certain populations from the national and political psyche.

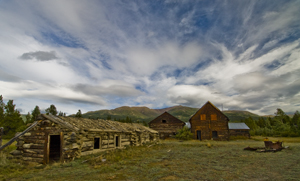
Old Ranch, Yukon River (2009) Photo (c) Karen Abrahamson

Maps have performed these roles for Canada since before the country was actually born. An example of the first comes from the period when the French and the English were still making their claims on North America. In the early 18th century, between 1713 and 1756, the French and English were engaged in a continuing dispute over what was English and what was French territory. This led to what might be called a war of maps, or at least a war of propaganda perpetuated through maps, with English maps having the audacity to present the French territory as a small area confined between the Ottawa and Saguenay Rivers in present-day Quebec, while the rest of North America – areas that had largely been mapped by French explorers – was claimed to be English. Oddly enough in the fight over what was French and what was English some of the battles, such as the argument over what was ‘Acadia’ (French) and what was ‘Nova Scotia’ (English) both sides presented maps prepared by their opponent. The trouble was, so much erroneous information was included in so many maps, you could pretty much support either argument.

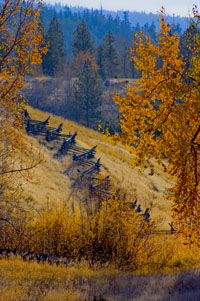
Snake fence along the Kane Lake Road, British Columbia, (2006) Photo(c) Karen Abrahamson

Maps also played a role in defining the border between Canada and United States. Dr. John Mitchell created A Map of the British and French Dominions in North America in 1755 and this was a pivotal map used by both of the fledgling countries in determining their borders. A Virginian, Mitchell became interested in maps as a result of concern over the French encroachment on territories the English had ambitions on. He began to collect information from travelers and publicly available maps, and compiled one of the first maps of North America. He wanted to expose the scale of the French Threat (they had been all the way down the Mississippi and far into the west by this point) to the British public and the colonies. Although his first map was crude, it showed enough promise he was commissioned to create something better by the Lords Commission on Trade and Plantations and was given access to the growing store of maps and charts coming from the new world.

The resulting maps showed a credible presentation of the boundaries of Upper Canada and, when the 1783 boundary negotiations between the United States and Britain began, the map helped to settle that the boundary would bisect the Great Lakes and then continue west. But that didn’t set the boundaries at the 49th parallel. It was another map, created by Jean Palairet, that erroneously showed the 49th parallel as the ‘agreed upon’ boundaries between French America and the Hudson’s Bay company. Although the French had never agreed to the boundary, the strength of a map presenting that fiction led the two countries to accept the 49th as their boundary in reality.

Two years after confederation, the fledgling Canada’s mapmaking had its first brush with making a culture disappear. In 1869, when the government sent surveyors into the prairies to prepare them for settlers, they were charged with measuring off the land, just as their American counterparts had done south of the border. They sought to mark off the land in one mile blocks, but when they came to the “hay privilege” lands of one Andre Nault, they were stopped by a group of Metis led by Louis Riel. You see, these descendents of marriages between native women and French explorers had established their own culture and place on the prairies. They had found that, in the arid landscape, the best way to divide the lands was using long strip land claims that flowed naturally back from each river or stream and thus allowed everyone access to irrigation. They viewed the government surveyors’ placement of each square mile on a map, as effectively wiping out their way of life. We know what happened—the Metis rebelled and Louis Riel was hanged and went down in history as an enemy of Canada. The Metis, like many First Nations people, were left as disenfranchised members of our country.

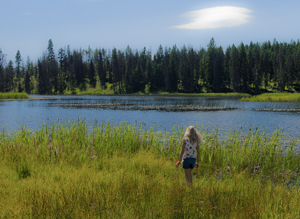
Small fishing lake in the B.C. Interior. (2011) Photo (c) Karen Abrahamson.

All of which shows how maps can be used to create or subdue a country—in this case mine. Happy Birthday, Canada. Let’s hope our maps of the future are a little more kind.


Andean Civilizations: A Map of a Different Color

Andean Civilizations: A Map of a Different Color

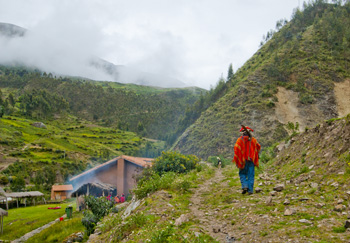
Off to the fields, Pumamarka (2011) Photo (c) Karen Abrahamson

When I think of maps I imagine back to when the first human made their first finger marks in mud to share a game trail, or a watering hole or an especially good berry bush. Surely that must have been the earliest form of map. Of course none of those primeval drawings exist, and so I’ve found myself writing a about the western development of maps over the ages and have tried to give a sense of the European tradition and the contributions of Arab and Chinese explorers and cartographers. This is the easy stuff to research and write about because the maps these cultures used were set down in a manner we are trained to see. Maps, to most of us, are a visual representation, usually on a flat medium like paper, that presents the relationship of one place to another. But other cultures have had other ways of presenting their landscapes, case in point are the great civilizations of the South American Andes.

What most of us think of as the Inca are actually a series of overlapping civilizations that rose and fell in the various livable areas of Peru, Bolivia, Ecuador, Columbia and Chile. After the very effective conquest of South American by the Spanish, not much remains of any Inca records and to date no maps (as we define them) have ever been found. But did these cultures simply not have maps or did they represent their landscapes in a different way?

Anthropologists and Cartographers say that formal mapmaking tends to occur within highly organized, bureaucratic societies as a form of discourse. The conditions necessary for mapmaking include: demands for agriculture, private property, long distance trade, militarism, and tribute relationships, amongst others, all of which are attributes of the various Andean societies.

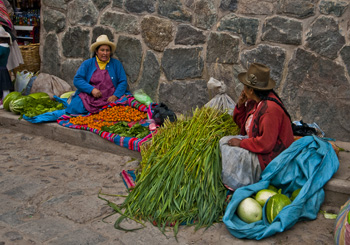
Women at Ollantaytambo market (2011) Photo (c) Karen Abrahamson

Anthropologists studying the various ancient cultures have begun to realize that westerners probably won’t recognize Andean maps until we start to see them through Andean eyes. The structure of maps aren’t only determined by geography, but also by social organization, cultural conventions and human perception. In the Inca worldview, the cosmos was built on a quartered circle, based on the way they viewed the Milky Way divide the heavens. They viewed their world that way as well, with the lands they ruled broken into four distinct quarters.

The Inca also had to map unusual terrain, from the coastal deserts and river oasis, up through the highlands to the alte-plano and Andes mountains and down again into the Amazon basin. Trade and tribute came those long distances, and north and south from Ecuador to Chile. Over those distict terrains there were distinctions of crop and animals at each of the different elevations. So, for an ancient Andean, among the things they needed to represent, were the different elevations, the different foods, and the waters that made life possible across these sometimes inhospitable terrains, as well as capturing the four quarters of the world and social relations.

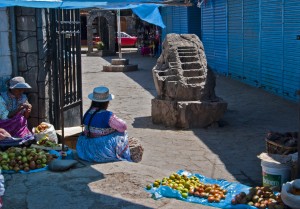
Market Scene, Chivay. Note the Inca rock that shows terracing and irrigation techniques. (2011) Photo (c) Karen Abrahamson

The resulting landscape representations convey things like ownership and elevation. Ancient weavings show the long narrow fields of produce separated by clan-assigned canals. Pottery shows spatial designs that encode critical social structures, and still other sculptures, such as Chieftain Vessels correspond to Andean landscapes with the head of the figure as the summit, the shoulders as central mountain slopes, the lower hips as the coastal plains where mountain rivers diverge on fields. Still other sculptures show realistic representations of the terraced fields and irrigation systems that make up areas of central highland valleys.

So while we might say the Inca made no maps, it doesn’t mean that they didn’t represent their landscape. The difference is that the Inca ‘maps’ were often three dimensional and layered with meaning, both in terms of the landscape, ownership and familial relationships, and the relationship of the landscape to their ancestors, the spirits and the cosmos.


The Star Raft: They came from the rising sun (part 2)

The Star Raft: They came from the rising sun (part 2)

Two weeks ago I wrote about the evidence showing contact between China and Africa long before the Portuguese sailed around the tip of Africa and into the Indian Ocean. More evidence of this appears from maps found in Korea and dating back to 1402 that show the WEST coast of Africa as far north as the Orange River, one of the longest rivers in Africa, which forms the international boundary between modern day South Africa and Namibia. This same map places Africa immediately opposite Indonesia with a string of small islands in between, suggesting that whoever drew the map, didn’t get there via India and the Gulf and down the African coast, but instead by sailing across the Indian Ocean. Records suggest some of these Chinese travelers came by way of a Star Raft. So who were these sailors and what is a Star Raft an how does this have relevance today?

Unlike later generations of Chinese dynasties, the Tang dynasty (A.D. 618-907) was outward looking and venturesome. This continued with the Southern Song Dynasty (A.D. 960-1279)who had lost half their territory to the Tartar hordes of the north. To make up for their property losses, they looked to oversees trade to fill their coffers and China became, for the first time, a maritime nation.

The ships they built had five or six decks, and carried a year’s supply of grain, herds of pigs and jars of fermenting wine. They carried the world’s most advanced seafaring technology in magnetic compasses, water-tight bulkheads, advanced rudder systems, sounding lines, and a sail designed for steering into the wind that could have allowed them to travel into the trade winds that had deterred the Arab seamen. By the end of the twelfth century they were on the edge of the western Indian Ocean and had appeared in the Gulf and off Yemen.

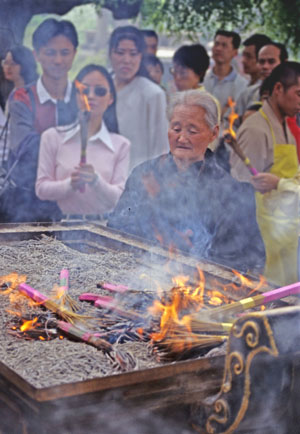
Old woman and Brazier and Xi'an Temple (1998) Photo (c) Karen Abrahamson

While many of these huge boats went no farther than India to trade, accounts from those few who went further also made their way back to China and described the port towns and the people they met. They describe the sources of ivory and rhinoceros horn, of frankincense, ambergris and a red gum resin called ‘dragon’s blood’ as a series of villages down the East African coast. News also came of the landscape and the African wildlife, including the marvelous creature called a camel-ox with a hide like a leopard’s, the hooves of a cow, no hump but a neck nine feet long perched above a body ten feet tall.

The contact between Africa and China continued, including embassies of African traders to the Chinese court. Proof of this comes both from Chinese records and from the diaries of Ibn Battuta, the many travelled Arab who wrote of meeting a man from Mogadishu who had been in China.

With the fall of the Song Dynasty and the coming of the Mongol hordes, the naval trade reduced, but the rise of the Ming Dynasty (A.D. 1368-1644) saw the creation of a huge maritime fleet that in 1414 sailed into the western Indian Ocean led by General Zheng He, Grand Eunuch of the Three Treasures. (See my short story here.) Zheng He was the Chinese Columbus, but the Chinese ships topped Columbus’s ships in every way. While Columbus sailed with three ships with single decks, Zheng He sailed with sixty-two galleons that each outweighed Columbus’s ships three to one. While Columbus had about 100 men, Zheng He had 868 civil officers, 93 commanders and 26,800 soldiers plus numerous others.

But unlike Columbus, who was a man of exploration, Zheng He led a Star Raft – an expedition planned to bring the ‘star-like radiance of the imperial ambassador’ and to win allegiance of distant people for the Chinese emperor. Yes, goods were traded during these voyages, but the symbolism of the exchange was unique to the Chinese. They believed that their trading partners were paying homage to the Chinese sovereign of the world. So unlike Columbus. the Chinese venture was based in looking inward – bringing the homage of other places to the center of the world.

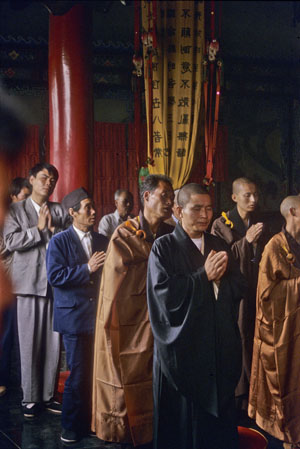
Inside a modern Xi'an Temple (1998) Photo (c) Karen Abrahamson

Which makes me wonder about the state of the world’s economy today as China’s economic engine begins to overtake that of the United States. Are we watching a modern-day version of the Star Raft as western companies and governments seek their trade accords with the new China?


Ray Bradbury and Rewriting the Map of Canada

Ray Bradbury and Rewriting the Map of Canada

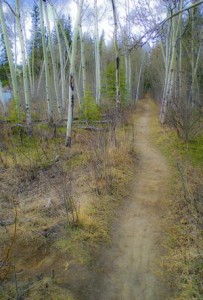
Woodland trail, Yukon, Canada (2009) Photo (c) Karen Abrahamson

Ray Bradbury died this week and as a science fiction and fantasy writer, his was some of the writing that most inspired me. I will forever be haunted by his horrific short story “All Summer in a Day,” but some of Bradbury’s best work were his cautionary tales like Fahrenheit 451, a terrifying look at the death of freedom and the burning of books in a fictional future. You might wonder what this has to do with the map of Canada, but bear with me.

This post will probably be as close to getting political as I will ever get, but events here in Canada have pushed me to the place where I finally have been forced out of the silent majority. You see the map of Canada is about to change. Not the physical map, perhaps, but the environmental map and the map of our hearts and our place in the world, and our children’s future is under attack so badly that I have to speak out. It feels very strange for a business person and writer who has always focused on fiction. For those of you who don’t live in Canada, here’s what’s at issue.

Small fishing lake in the B.C. Interior. (2011) Photo (c) Karen Abrahamson.

1. Our federal government is currently introducing legislation, Bill C 38, that will abolish most of our environmental protection legislation. They claim that they are trying to clean up the legislation in order to make it ‘make sense’ for municipalities and farmers, but in reality, while they might cut some red tape, they are getting rid of any legislation that might block the immediate implementation of major corporate initiatives, like the Enbridge Pipeline that will cross some of the most rugged and pristine landscape in Canada, from Alberta to the Pacific Ocean. This pipeline will cross hundreds of miles of wilderness and thousands of salmon-spawning streams to bring the dirtiest type of oil to the Pacific Ocean. Once there, this same legislation erases much of the laws in place to protect the pristine waters of British Columbia. It will allow oil tankers to ply the delicate environmental areas of the inland passage to take this dirty oil to China—one of the worst polluting countries in the world. Think Exxon Valdez. The legislation also removes the safeguards in place for many endangered species, because, the new legislation says, these species aren’t really important.

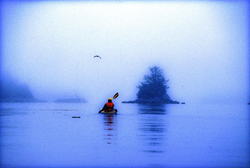
Kayaking the coast of British Columbia (1996) Photo (c) Karen Abrahamson

2. At the same time this government is systematically silencing any opposition. Along with this salvo against the environment which shortens any environmental assessments and limits who can even participate in the discussions, the government has also launched an attack against non-profit societies and charities, by imposing restrictions that stop these charities from any sort of advocacy against government actions. This attack has specifically been leveled at environmental organizations because they receive donations from other countries and this government is threatened by the groundswell of reaction from around the world about what they plan to do. They are changing the rules to hamstring any opposition against the huge oil corporations.

At the same time, they either stop funding scientific research, or they place gag orders on all remaining government scientists who might provide a voice of reason or evidence that government actions are wrong. But then I shouldn’t be surprised. This government doesn’t believe in science.

Even Members of Parliament who try to express what their constituents want are silenced. And when members of the United Nations commented recently on the impoverished state of our First Nations population, this government told them to go away and focus on third world countries. It seems Canada, in this government’s eyes, is beyond criticism.

All of this paints a picture that should terrify anyone concerned for our future. For someone who has always been a proud Canadian these actions are only the tip of a blood-chilling iceberg. It leaves me to think that, instead of the great white north that has stood proudly for freedom, integrity and honour both here and abroad for 145 years, we are being transformed into a country I only read about as in Ray Bradbury’s writing.

Welcome to totalitarian Canada – next comes the book burning.


They Came From the Rising Sun

They Came From the Rising Sun

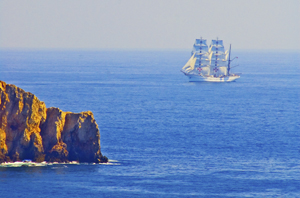
A Portuguese ship off the Algarve. Photo (c) Karen Abrahamson

I’ve spent much of this blog writing about the great European mapmaking tradition and the exploration that went with it, but long before European Kings considered funding a certain wild venture to reach India and China by sailing west across the Atlantic, and long before Vasco de Gama sailed round the Cape of Africa and into the Indian Ocean, the Chinese were venturing westward, too. They sailed from Canton and through the Malay straight and into the Indian Ocean. They mapped it, too.

Chinese records indicate that trade between China and Africa began as early as the Han Dynasty (202 BC to AD 220). Two of Africa’s most powerful nations of the time, Kush and Axum had trade relationships through intermediaries. In Kush the remains of ancient pottery and bronze utensils indicate that they may have been copying the styles of the Chinese goods being brought to its ports by Arab traders. Axum may have been the source of the rhinoceros horn, ivory and tortoise shell that Roman traders took to China in AD166.

But this was trade by intermediary, not face to face trade. The first trade by Chinese with African is thought to have occurred not much later, but it probably didn’t occur on African shores. Accounts of ancient travelers indicate that in places like Ceylon merchants and sailors from as far afield as China, Persia, Homerite countries and Adulis (an African port city) came together to trade. One Chinese trader, Fa Xian, stayed in Ceylon for two years before returning home to write his accounts of the people he met.

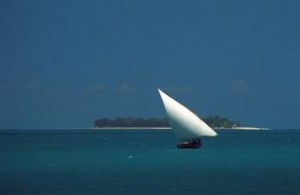
Dhow off Zanzibar Island (1994) Photo (c) Karen Abrahamson

During the time of the Tang Dynasty (618-907) records show that a Chinese did set foot on African soil. Du Huan, was a Chinese military officer who was captured by the Arabs during conflicts near Samarkand. After spending twelve years in the Abbasid Empire, he reappeared and wrote a record of his travels. Of the bits of that memoir that have been preserved over the ages, he speaks of travelling south over a great desert to the land of the black people, where there was little grain and no vegetation and malaria was endemic. Researchers today think this was probably modern-day Eritrea.

A Chinese junk from the 1270s was discovered in Guangzhou harbor in 1974 with cargo such as tortoiseshell, frankincense and ambergris that strongly suggest trade with Africa. Between 800 and 1400 Chinese goods were also making their way to Africa so that Chinese porcelain became common as decorations on houses and mosques and broken porcelain still apparently litters East African beaches. Chinese coins from the Tang Dynasty (the kind with the square hole in the middle) have been found along the coast and on islands like the Bajun and Zanzibar.

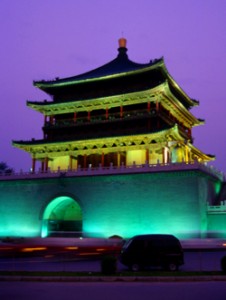
Chinese tower, Xi'an, China (1998) Photo (c) Karen Abrahamson

Of course, the Chinese travelers to these distant shores in these early days weren’t representatives of the Chinese dynasties. No they were merchants and traders. Most of these went as far as India and no farther and were content to trade with the middlemen who brought goods from Africa. But a few travelled further and the routes were known in the Kingdom of Heaven. In the ninth century the Tang Prime Minister and geographer, Jia Dan, knew of the sailing routes that gave 90 days from Canton to Arabia and 20 days for a further voyage southwest to a country called Sanlan.

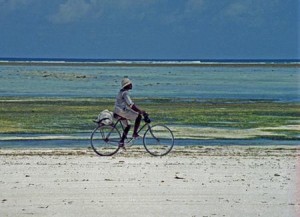
Cyclist on the western Zanzibar beach. (1994) Photo (c) Karen Abrahamson

Of course, if the Chinese were anything like the later Portuguese, this information could have come from Arab sailors as a result of the government confiscating all maps from visiting sailors, but a map compiled between 1311 and 1320 by the Chinese cartographer Zhu Siben clearly shows the triangular southwest pointing African continent at a time when the western world thought that Africa didn’t end, but instead the landmass continued on eastward before joining the mainland again and enclosing the Indian Ocean as a great inland sea.

Just think of what this map suggests: The Chinese were there first. If they had kept going, they could have discovered Europe long before the Europeans ‘discovered’ the route to China.


The Comet and the Cartographer

The Comet and the Cartographer

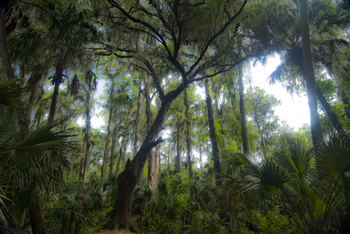
Cypress tree, Northern Everglades (2012) Photo (C) Karen Abrahamson

I’ve written earlier about the way maps are used to convey information about our world and how the information maps convey has extended far beyond the basic morphology, and the boundaries and formations humans place upon the earth. But how did the idea of using maps to present things like the distribution of population and average income come about?

The potential for such maps stretches right back to Ptolemy, but it was a certain Edmond Halley who made the first of what are known today as thematic maps. You see Halley, the same Halley who was a friend to Isaac Newton and who, in the 17th century, predicted the periodic return of a certain comet, also predicted that certain phenomena may be better presented as maps than through the use of words. He produced what is considered the first meteorological chart – of prevailing winds. He also published a map of the North and South Atlantic which showed variations of terrestrial magnetism by charting variations of the compass needle from true north. His map, created after two years of observations, charted these variations by using curved lines on a map that connected areas of equal value—a process that is used today, with isolines connecting areas on a map of similar elevation or depth.

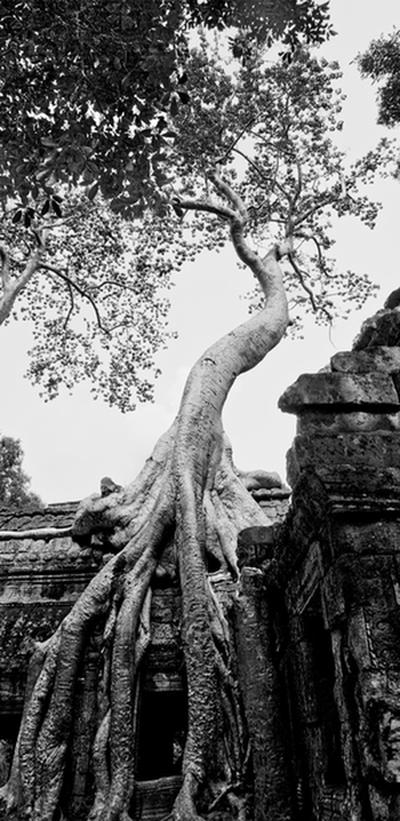
Fromage Tree, Angkor, Combodia (2009) Photo (c) Karen Abrahamson

The inspiration Halley provided led to the creation of maps in the 19th century that set out similar lines, isotherms, for temperature and isobars for barometric pressure. In the 19th century other means of conveying information beyond basic geography were also developed. For example, the use of larger or smaller circles to convey larger or smaller cities. Plotting of incidents of cholera and London water pumps on a map not only showed where the deaths occurred, but also demonstrated the use of maps as analytical investigative tools when all the deaths could be linked to a single water pump.

The development of thematic maps has continued, with odd maps called ‘winds of influence’ that group places of similarity such as use of technology, so that, in the 1980s, first-world countries were grouped closely together, while third world countries were separated by distance, illustrating how far behind some countries were. Maps of influence helped track and demonstrate the spread of botany across the South Pacific, and also gave clues to the spread of Polynesians over the Pacific.

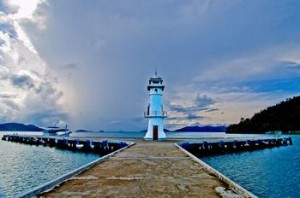
Lighthouse, Ko Chang, Thailand. (2009) Photo (c) Karen Abrahamson

So while Halley gifted us with the understanding that a comet returns periodically to our night skies, his greater gift might be the idea that maps can be so much more than representations of geography and international boundaries. Most of all, his use of isolines led to the bloom of maps as a means of showing the connections within our world.


Knowing Where We Are in the World – and in Story

Knowing Where We Are in the World – and in Story

Cypress tree, Northern Everglades (2012) Photo (C) Karen Abrahamson

I’m currently working on two pieces of writing. One is the third novel in the Terra Trilogy and the other is the third installment of the Ice Dragon Series of short stories. Working on these two projects has made me question how I know where I’m going and how do I know where I am in relation to everything else in both these stories. It brings to mind the question of how we know, in our real life, where we are in relation to the rest of the world.

In this day of GPS and mapquest etc. this might seem like a very easy question to answer, but it wasn’t always this way, just like I wasn’t always able to have a sense of where I am in a story. Yes, surveyors took it upon themselves to survey the world. Countries (and scientists) agreed on the prime meridian that impacts all our time zones. But the 20th century has primarily been concerned with improving the precision of mapping and in particular with ensuring the pinpointing of places on the map in relationship to the rest of the world. The US Geological Survey was involved in this through most of the 20th century.

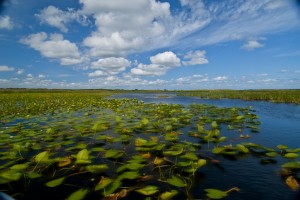
Waterlilies, Northern Everglades (2012) Photo (c) Karen Abrahamson

Why is this important? Well, think about it. Without standard understanding of how everything relates to everything else, weird things happen, like bridges getting built from each shore that don’t meet in the middle, or highways that have weird jogs in them because the measurements allowed the two ends to miss each other. It might not be important to you, but the cost overruns of such mistakes make having a common context for measuring everything important because it stops these types of things from happening.

In North America, the result of the surveying is those nice little brass discs (known as monuments) set in concrete or rock dotting the landscape . Each of these little brass discs serves as a known point for all subsequent surveying in the area. How did they know the individual location of these monuments? They took meticulous measures of distance through triangulation surveys and also measured the azimuth—the direction of Polaris—to set each monument’s position.

Throughout America, broad swaths of land were surveyed independently to create grids of known locations. They measured locations not only horizontally across the landscape, but also vertically, in relation to sea level, but the challenge was knowing that all these grids fit together. The result was the selection of a single monument at a ranch in central Kansas, Meades Ranch, as point zero for all grids across the country. Meades was chosen because it sat centrally in the US and it lay close to the crossing of two major survey lines across the US – one from Canada to Mexico and the other from the Atlantic to Pacific Ocean. Interestingly, today Meades Ranch has been superseded by global positioning that uses the center of the earth as the central point of reference.

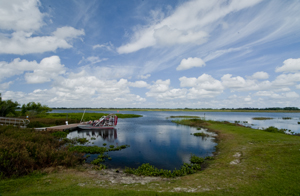
Airboat docked in the Northern Everglades. (2012) Photo (c) Karen Abrahamson

The use of that central point for mapping draws me back to my thoughts on plotting a novel or story. I once heard the wonderful writer, Nancy Kress, talk about plotting. Now I don’t know how you feel about plotting—some people are all for detailed plotting of everything in a novel, while others prefer to fly by the seat of their pants (Pansters) and write into the mist of their imagination. Nancy Kress seemed to offer a third alternative that didn’t hold a writer’s imagination down, but also gave some structure to writers so that all that lovely mist didn’t turn into a dense blinding fog. Ms. Kress suggested that writers need to write down what they think is going to happen in the novel. Just brainstorm them out. Ask yourself what is the beginning (the inciting event) and what is the midpoint (quiet often a reversal of some sort), and how do you think the story will end (the climax)? Once you have those key points identified, you can easily place them on a plot line and them locate all your other plot ideas on either side of the midpoint—a lot like being able to measure your location from Meades Ranch.


Books and Geology: Mapping Beneath the Surface

Books and Geology: Mapping Beneath the Surface

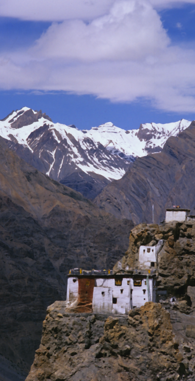
Cliff-side Monastery, Spiti Valley, India (2000)
Cliff-side Monastery, Spiti Valley, India (2000)(photo (c) Karen Abrahamson)

Recently I was reflecting on the difference between plot and story, with plot being the events that happen to keep the story moving, and ‘story’ being what the book is about and the changes that occur to the characters along the way. Frodo starts out as a happy young hobbit, and returns as someone who understands the price that must be paid for the safety of places like the Shire. Bella starts out as this infatuated, clumsy girl who constantly has to be rescued, and turns out to hold the secret abilities to save everyone.

This got me thinking about mapping beneath the surface. In a book, if you are a plotter, you map out where the actions occur, but also the impact the scene has on the character. I started out writing this way, and used wonderful planning sheets like these. This has allowed me to layer stories with the emotional changes that make a story much richer to read.

A similar process has occurred in mapping the world. Once the surface mapping was well under way, people began to wonder how to map the landscape under the layer of dirt and forests we see. Why? To gain a better sense of the layering of the landscape and the connections between places. For example, the discovery of similar strata layers in both France and England demonstrated that once they were a single land mass.

The process of mapping the underside of the earth began around 1750 when a Frenchman named Jean Etienne Guettard asked just such a question about England and France. Though he posed the question, the first person taken seriously for geological mapping was an Englishman named William Smith who spent a quarter of a century mapping England and Wales beneath the ground. Smith had been a surveyor’s helper and a keen observer who noticed and recorded things like strata exposed in hillsides and in mine shafts. Smith was the first person to have the insight that different strata held different fossils from different time periods, which provided a means to date the strata. He also noted that similar fossils were found in similar strata, even though they were separated by long distances. In 1815, the result of his study was a many-colored map of England and Wales that set out the different geological formations.

Off to the fields, Pumamarka (2011) Photo (c) Karen Abrahamson

Such a map can set out the distribution of various geological units such as glacial debris (if it was near the surface) or deeper formations like igneous, metamorphic or sedimentary rock that underlie the topsoil. Of course, having a general picture of the structure of the earth wasn’t enough for a civilization with an increasing thirst for oil and minerals, so processes were developed that measured gravitational attraction from which geologists could deduce the nature of the subsurface geology. Other processes drew on the ancient Nordic use of magnets to locate ore bodies. A more modern magnetometer was developed in the 1930s and mounted on aircraft to gather readings. The Seismic method was developed after 1875 when an English geologist in earthquake-prone Japan, thought to use a seisomograph to determine where the quakes arose from. A similar process was used in 1909 to discover the boundary between the Earth’s crust and its mantle.

Using sonic sounds or thumpers or vibrators to create sound, the sonic process then uses geophones (or hydrophones for underwater exploration) to read echoes from underground formations that tell the scientists what lies underneath.

This has led to the ability to measure the crust of the earth (which measures from about 6.5 kilometers thick under the ocean to 50-75 kilometers thick under high mountains), the mantle which extends from the crust to about half way to the centre, and the dense, partly molten core. Seismology has led to the ability to map oil deposits and layers of water and natural gas that wait in the earth’s crust. But they have also allowed scientists to reach much deeper.

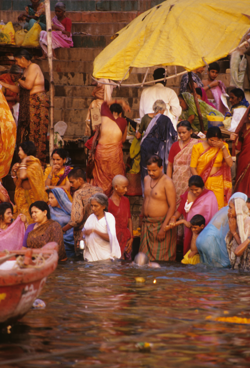
Main Ghat, Varanasi
Main Ghat, Varanasi (2000) Photo (c) Karen Abrahamson

Geologists are now able to measure and map the underside of the earth’s crust (I alluded to this here). Which is a lot like understanding the underside of a novel, because, like the geothermal power of the earth that may save us from global warming,  it’s really the hot emotional underbelly of a novel that brings out the best of any novelist’s writing.


Recent Fantasy

Available HERE,

$1.99

Available HERE,
$3.99

Available HERE $1.99


Recent Mystery


Available HERE
$4.99


Available HERE,

$4.99


Available HERE,

$4.99


Available HERE,
$4.99


Recent Romance

Available HERE, $2.99